Kate Myatt and Marc Blum
Prentice Centre
The University of Queensland
Brisbane, Australia, 4072
{k.myatt,m.blum}@cc.uq.edu.au
The Prentice Centre manages and supports the University of
Queensland's dialup networking services for over 13000 staff,
students and external clients .The purpose of this paper is to
describe how the Centre has handled the usage and access control,
hardware management, and user support and administration required
to maintain a service of this magnitude.
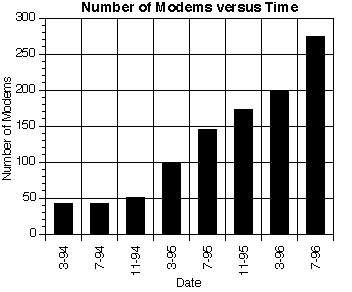
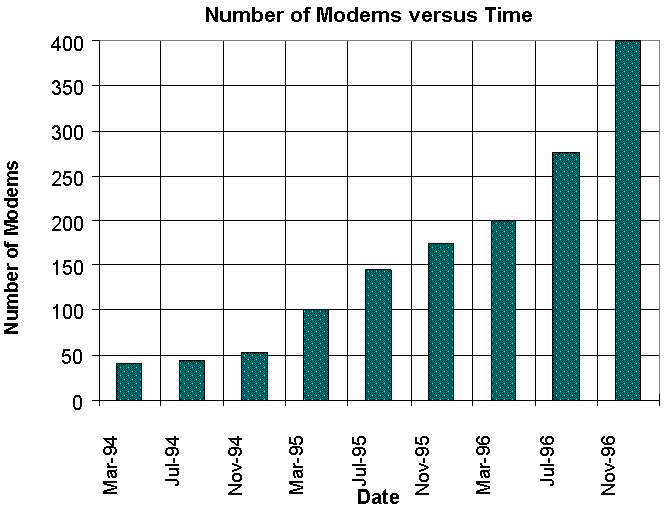
The University of Queensland, through The Prentice Centre, offers dialup networking services to all staff and students, free of charge, and to external clients, for an annual fee. The last two years have seen astronomical growth in the service to our current user base, of over 13000 accounts accessing more than 200 modems (Figure 1). Over 5000 of these accounts are used each month (Figure 2). The scale and growth of this service, coupled with the decreased computer literacy of users, has necessitated constant reviewing and updating of the management and support methods used.
The improvements to and expansion of the management techniques detailed in, Management Techniques for Large and Congested Modem Banks (Kate Barnes and Mark Williams) presented at QUESTNet95 are reviewed along with new initiatives for administration and user support.
The usage and access restrictions are continually reviewed in an effort to provide the best and fairest service with very limited resources. The management software has been completely rewritten with more functionality, easier configuration and greater efficiency to meet this need.
Significant advances have been made in the management of the hardware, in particular, the use of SNMP management tools. Additionally, it is expected that changes to the communications hardware will provide scope for more flexibility in management.
Probably the largest impact on centre resources has come from
the administration, both clerical and systems administration,
of the service and the demand for user support. Several initiatives
have been introduced and new staff members have been employed
to meet these demands.

Two levels of access control are needed for the dialup service.
The first level is user authentication, to limit access to a range
of users. The second level is modem access control, to limit the
range of modems each user is able to connect to.
The first level ensures that clients can be identified and stops
illegal access to the modems.
The second level is necessary for two reasons. Firstly, the modems
need to be able to be partitioned into groups corresponding to
different clientele. Staff, students and external clients all
have access to a different set of modems. Secondly, since we provide
permanent internet connections for clients using modems, we need
to ensure that only they can connect to their modem at our end.
As well as controlling access to modems, it is necessary to regulate
the number of users connected to a pool of modems at the same
time. The goal of congestion management is to provide reasonable
connection time for the maximum number of clients. With a limited
supply of modems it is not possible to maximise the amount of
connection time per client as well as the number of clients using
the modems. To increase the number of clients able to make use
of the modems, or the probability of clients obtaining a connection
when they dial in, it is necessary to place limitations on how
much time each client is able to use. Since modem usage is not
evenly distributed throughout the day there exist periods where
the modems are under utilised. Encouraging clients to utilise
off-peak times is a way of increasing the overall usage of the
modems without adversely effecting the quality of the service.
Congestion management alleviates the problems caused by high user
per modem ratios such as exist within the University of Queensland
dialup service. Table 1 gives details of the number of users per
modem for each rotary phone number at the University of Queensland.
These statistics show numbers of users who have used these phone
numbers during a period of one week and an estimate of the number
of working modems for each rotary phone number during that week.
| Phone Number | Number of Modems | Number of Users | Users : Modems | Description of Users |
| 3365-4900 | 41 | 1482 | 36 | Students, staff, and paying clients |
| 3870-3227 | 58 | 2212 | 38 | Students, staff, and paying clients |
| 3871-1766 | 30 | 1425 | 48 | Students, staff, and paying clients |
| 3870-7257 | 44 | 597 | 14 | Paying clients |
| 3291-2585 | 16 | 362 | 23 | Staff |
| 3291-2577 | 31 | 290 | 9 | Paying clients |
Clients are only disconnected when the pool of modems is congested.
Hence clients are free to access the modems during uncongested
periods for as long as they like. This encourages clients to take
advantage of off-peak periods, resulting in a more even distribution
of modem usage throughout the day.
A threshold of connect time is allocated to each user. To be disconnected
a client must have exceeded the maximum call length during a period
of peak usage, or have accrued more than their threshold of connection
time recently. Users are disconnected in order of magnitude of
their excess connection time. Hence clients who have used the
modems least are favoured, as well as clients who use the modems
during non-peak periods.
It has been found that disconnecting users is not enough to reduce
congestion. Typically users will dial in immediately after they
are disconnected. This gives clients waiting to connect only a
very short time to do so while there are available modems. To
increase the turn-over of users after a series of disconnections,
it was decided to temporarily block clients from accessing the
modems as part of the disconnection process. This stops users
from being able to dial in for 15 minutes after they are disconnected,
allowing other clients to obtain a connection.
It is difficult to measure the effectiveness of these policies.
Congestion management is only one factor that contributes to modem
usage. The two principle variables, the number of users and number
of modems, change constantly making comparisons across time difficult.
Faulty equipment can also significantly impact modem usage. Until
recently we have not been generating adequate statistics for the
purpose of assessing performance quantitatively.
Feedback from our clients and our own experiences with using the
modems has justified the congestion management policies. Basic
monitoring of the modems has shown that during congested periods,
the software has been able to maintain numbers of free modems,
allowing greater numbers of clients to gain access during these
times.
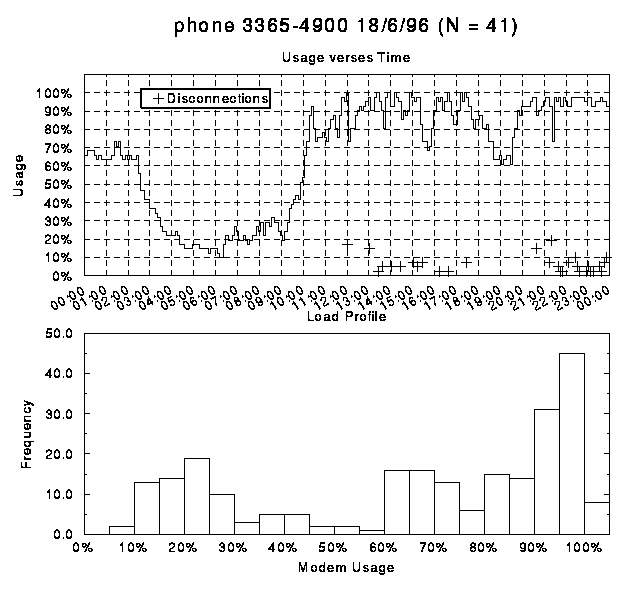
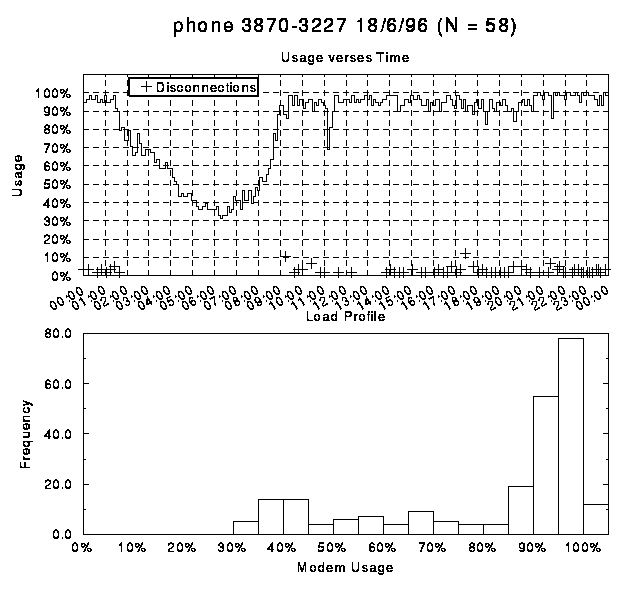
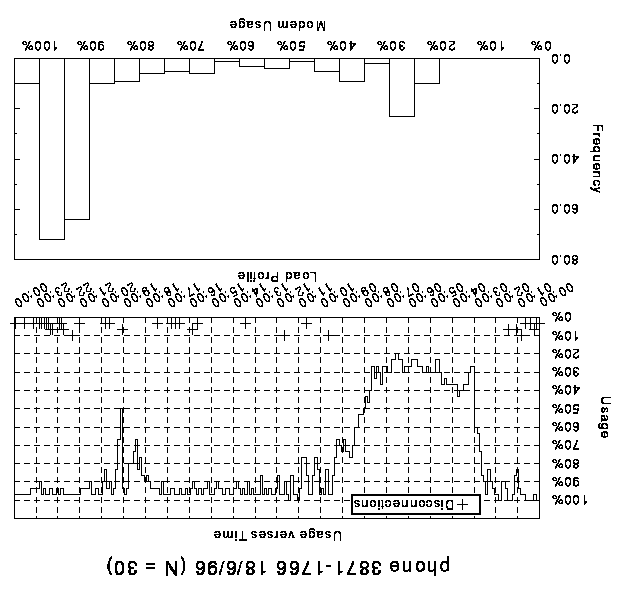
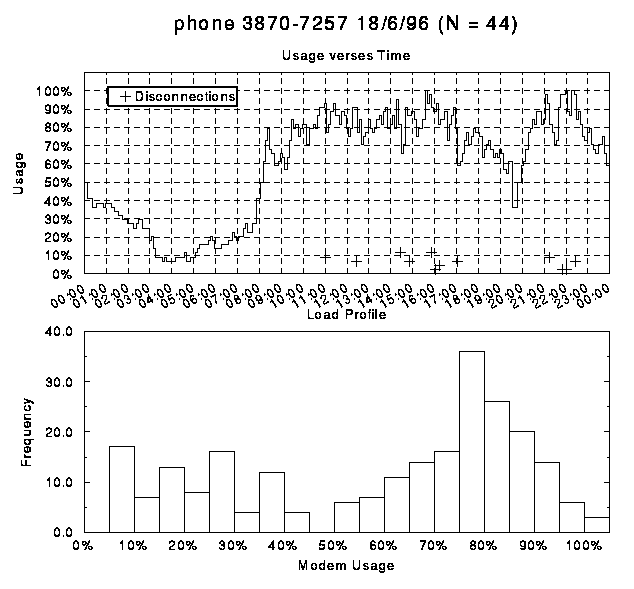
The following is a series of graphs of modem usage on each of
the modem banks. These graphs clearly indicate how during periods
of peak congestion the number of modems in use fluctuates rather
than remaining at the maximum level. Generally these fluctuations
correlate with client disconnections marked by crosses. It is
inferred that clients who have exceeded their threshold of connection
time, or been connected for a long time during a period of peak
usage, are being disconnected to allow other clients to use the
modems. The load profiles show that modem usage does not remain
at 100% for a high proportion of the time, with modems still being
well utilised.
The modem management software provides both access control and
congestion management. It works with the Xylogics Annex
communication servers and their accompanying software, and runs
under the Unix operating system.
The software provided with the annexes already allows access
control based on user authentication. This software has been modified
to limit access by users to particular modems.
Up to 16 pools of modems, or modem banks, can be defined
which are treated as units with respect to access control and
congestion management. These modem banks need not correspond to
modems connected to the same annex. Logically they correspond
to modems on the same rotary phone number or numbers.
Each user has an access-code that determines which of the
available modem banks they are able to access as well as which
private modems, if any.
The software relieves congestion by the following process. The
modem banks are polled to detect when they are congested, that
is a specified number or proportion of the modems are in use.
If a bank is congested then the software attempts to disconnect
users until the number of connected users is less than the congestion
level by a specified safety margin. Users are disconnected according
to three criteria: the amount of time they have been connected
recently; the length of their current connection; and the time
of day. Before a user is disconnected they are given a warning
to enable them to complete what they are doing. Unfortunately
the current software does not issue warnings that are visible
to users with a TCP/IP (SLIP or PPP) connection. When a user is
warned they are temporarily blocked from accessing a bank or group
of banks until a specified period after they are disconnected.
When clients are disconnected they are notified by electronic
mail with an explanation of why the software disconnected them.
Clients with the greatest excess connection time are disconnected
first.
The statistic used to measure connection time is the amount
of time connected on the current day and during the previous 6
days. It was important to choose a statistic that did not bias
any particular day of the week or time of day too much. The amount
of time used since the previous Monday would be an inappropriate
statistic, since users would never be disconnected on Mondays
and often on Sundays. Ideally the statistic should be a sliding
window of fixed width and continuously varying starting point,
for example the amount of time used between exactly 7 days ago
and now. For ease of computation, the statistic used corresponds
to a time window that varies slightly in its width and incrementally
in its starting point. The disadvantage is that there is a small
bias towards users being disconnected at the end of the day. The
advantage is that the algorithm that computes this statistic is
significantly more efficient without being overly complex.
The software also allows different times of day on different modem
banks to be weighted with respect to calculating the connection
time statistic. For example, peak periods on specific modem banks
could be weighted so that connection time accumulates twice as
rapidly as normal. This feature of the software has not been used.
The software allows users to have privileged access to
a bank or group of banks. This exempts them from being disconnected,
blocked, or accruing connection time on these banks.
The software is fully configurable via a text file. Table 2 summarises
each configuration parameter.
| Parameter | For each | Description |
| Detect Time | Congestion Manager | The time between polls of the modem banks to determine whether they are congested. |
| Annex Name | Annex | The name of the annex. |
| Annex IP-address | Annex | The IP-address of the annex. |
| Number of Modems | Modem Bank | The number of working modems in a modem bank. |
| Congestion Level | Modem Bank | The threshold at which a modem bank is considered congested. |
| Safety Margin | Modem Bank | When a bank becomes congested sufficient numbers of users are disconnected to make the total number of used modems equal the Congestion Level minus the Safety Margin. |
| Warning time | Modem Bank | The number of minutes between when a user is warned and when they are disconnected. |
| Block time | Modem Bank | The number of minutes after a user is disconnected that they are blocked from using the group of modem banks. |
| Blocked banks | Modem Bank | The group of modem banks that a user is blocked from using. |
| Call length limits | Time Period per Modem Bank | The maximum allowable call length for a given time period on a given modem bank. |
| Time period weightings | Time Period per Modem Bank | The weighting applied to connection time for a given time period on a given modem bank. |
The different components of the software produce log files for
error detection and performance monitoring. It is also important
to log events generated by the software in order to provide explanations
to clients about its behaviour, such as why it disconnected them
at a particular time. Table 3 gives details of each of the log
files.
| Log File | Information |
| User logins | The start and finish time of each connection made by a user. The modem port as well as the mode they were in when they disconnected: command line, SLIP or PPP. How much time they accrued during the connection. |
| Disconnections | The time of each warning, disconnection and un-block with the corresponding user-name and modem port. Information about the user is also recorded including the time at which their connection began as well as what mode they were in and how much connection time they had accrued recently. |
| Congestion Statistics | The number of users connected to each modem bank as well as how many the software tried to disconnect, and how many were actually disconnected at different times. |
Three components need to be maintained in order for the software
to function correctly.
The first of these components is the configuration file. This
file needs to be modified each time the congestion management
policy is altered for an existing bank, or a new bank of modems
or a new annex is added. It must be updated each time the number
of working modems changes, which tends to occur daily.
The second component is a user database used to record the following
information about each user: the banks they can access, their
threshold, the time they have accrued, and which banks they have
privileged access to.
The third component is the port database which contains information
about each port on each annex that is connected to a modem.
The port database determines the way the physical hardware is
mapped to logical modem banks.
Commands to add or change, remove, and display records for both
databases have been written. Whilst these commands are reasonably
flexible, to perform complex operations on the databases it is
generally necessary to use them in conjunction with Unix commands
such as grep, awk, and perl. These databases
generally need to be updated when a new modem bank is added to
the system. Auxiliary software has been developed to help automate
the process of maintaining these databases, but much of this is
quite specific to University of Queensland systems.
The software has evolved from a prototype written by Kate Myatt
as described in the paper,
Management Techniques for Large
and Congested Modem Banks (Kate Barnes and Mark Williams)
The prototype was written as quickly as possible in response to
the huge demand placed on the modems when the Prentice Centre
started providing dialup services to all university staff and
students as well as to clients external to the university. The
original software worked very well to decrease congestion and
provide access control. Needless to say, as demand has continued
to increase dramatically it has been necessary to improve the
software.
The prototype software was written in various Unix scripting languages,
had fewer features, and was difficult to re-configure for different
hardware configurations and management policies. It has been rewritten
in C++ for greater efficiency, modularity, ease of maintenance
and code interpretation. The algorithms used have also been modified
for greater efficiency. The code has been written to be portable
and reasonably easy to modify for use with hardware other than
the Xylogics annexes.
The software has been under development since September 1995.
It was tested and revised significantly in February and April
of 1996. The current version has been running with few problems
since March. This version has most of the features described above.
A new version with all these features has been written and is
currently being tested.
A significant amount of time has been spent developing scripts
and small programs to augment the logging facilities of the software,
generate graphs and reports of performance, and maintain the various
databases associated with the software.
It is expected that in the near future the software will be able
to provide warnings to users in SLIP or PPP mode. No other changes
are planned although it is expected that at some time in the future
the software will need to be modified to handle a greater range
of hardware.
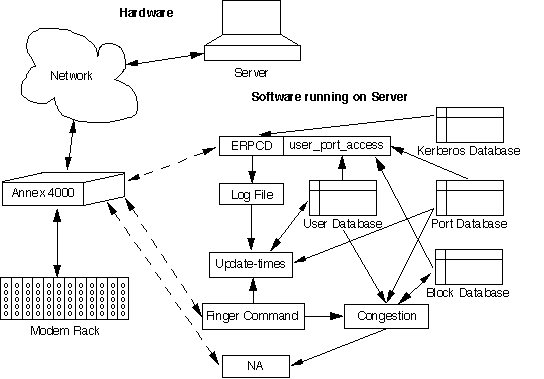
Figure 3 represents the different
components of the software and hardware and the relationships
between them. Solid lines represent links between hardware components,
or links between software components. Dashed lines represent virtual
links between hardware and software components. The arrows
indicate the direction of information flow.
The hardware includes the modems, the annex communication
servers, and a Unix server. Each modem is connected to a port
on an annex. The server runs the modem management software
as well as providing time-keeping, booting, logging, and security
functions. Software for remote monitoring and management of the
annexes also runs on this machine.
The erpcd(Expedited Remote Procedure Call Daemon) is a
daemon that runs on the server continually and provides booting,
security, and logging functions for annexes. Each time
a user attempts to connect to a port on an annex, the annex
passes control to the erpcd which performs the necessary
security functions. The erpcd has been altered to incorporate
port-based security. After identifying a user, the Kerberos
security database, it accesses the user, port and block databases
to determine whether the user is allowed to connect to the annex
port.
The port database is a single table with records for each port.
Details of each field in the port database are shown in Table
4.
| Field | Description of Field |
| Port-name | The annex the port belongs to and the port number |
| Access-code | A 32-bit code with a single bit set. If one of the lower 16 bits is set then the port belongs to the modem bank corresponding to that bit. If one of the upper 16 bits are set then the port corresponds to a private modem. |
The user database is a single table with records for each user.
Table 5 shows details about each field in the user database.
| Field | Description of Field |
| User-name | The users system user-name. |
| Times[0...6] | A sequence of 7 numbers corresponding to the number of seconds used today and on the previous 6 days. |
| Access-code | A 32-bit code which determines which ports the user is allowed access to. The lower 16 bits correspond to modem banks. The upper 16 bits are reserved for privately owned modems. If a bit in this code is set then the user is able to access ports that have the corresponding bit set. |
| Privilege-code | A 16-bit code which determines which modem banks the user has privileged access to. Each bit corresponds to a single modem bank. |
| Threshold | The connect-time threshold in seconds. |
The block database is a single table with records corresponding
to each block currently in place. Table 6 shows details of each
field in the block database.
.
| Field | Description of Field |
| User-name | The system user-name of the user who is blocked. |
| Bank-code | A 16-bit code determining which modem banks the user is blocked from using. Each bit which is set corresponds to a bank that the user is blocked from accessing. |
| Expiry Time | The date and time at which the block will expire. |
The interface to the port-based security functions in the erpcd
is a single procedure called user_port_access. This procedure
takes the user-name and port as parameters and returns one of
three values corresponding to: access allowed, access denied,
and access blocked. It accesses the user, port, and block databases
to determine the return value.
The update-times process computes the connection time accrued
by each user. The process is run at regular intervals to update
the user database with this information. It processes the log
files produced by the erpcd as well as communicating directly
with the annexes using the Unix finger command.
The finger command returns information about the status
of current connections to an annex. The algorithm used
is efficient since it only needs to process the erpcd log
records generated since the software was last run. It does not
need to process all the records that contribute to the connection
time statistic each time it is run. The algorithm uses the finger
information to correct for errors in the log files.
na (network administrator) is used to configure and control
annexes. It features commands to send text messages to
particular ports on annexes and to reset ports. This first
feature allows warnings to be sent to clients that have a serial
data connection to an annex port. The second feature allows
clients to be disconnected.
The congestion process is a daemon process running continually
on the server. At regular intervals it polls the modem banks using
the finger command to determine whether modem banks are
congested. If a bank is congested then a disconnection process
is started to relieve congestion on the bank. The user database
is accessed to determine how much excess time each user has accrued.
The finger information is used to determine the length of current
connections. Based on this information a list of users to be disconnected
is generated. Commands are sent to an na process to warn
and disconnect users. Users are blocked temporarily by adding
a record to the block database and removing it when the block
is due to expire.
Improving the management of the modems and terminal servers results in a better, more reliable and more consistent service. The introduction of specialised equipment coupled with simple and effective practises has reduced the management load. This in turn has reduced the general management and support required for the dailin service. Furthermore, it is expected that changes to the communications hardware will also improve the service significantly. Currently, one technician is employed full time for communications hardware management with other engineers and technicians providing additional support equal to, at least another full time staff member.
The University modem pool at St Lucia consists of over 200 dataplex, octocomm and GDC modems on 6 phone numbers. These are configured as 3 rotaries, or Hunt groups, on external lines, one on the internal PABX, and 2 digital groups. There is an additional phone number on the Gatton PABX. The modems are connected to UQNet via seven Xylogics Annex Terminal Servers (4 Annex4000 and 3 Annex3) at St Lucia and one Annex3 at Gatton.
The success of the centre's venture into SNMP management of the modems has been very manufacturer dependent. Some suppliers still have some more development work to do before their systems are useful. However, four racks, each containing 16 dataplex modems and one management card, are now successfully managed from one remote PC running Dataplex AccessPoint software.
The system is now being used to
The management software is not yet used to its full potential but there are plans to use the more sophisticated functions as they become available with new versions of software.
The next step will be to use the software to monitor the modems for any abnormal behaviour. Thresholds for occurrences of certain events can be set to trigger alarms when they are exceeded. For example, if a certain event occurred say five times out of the last ten call attempts the software would indicate this in some way. This may be an audible alarm, or a change in the appearance on the display of the affected equipment. By flagging events such as, abnormally short calls, failed calls, disconnected calls, or changes of configuration, faults, which may have been difficult to detect by other means, are quickly apparent.
One simple technique is to produce a table daily using the modem management software, showing the average log in time on each annex port over the last 24 hours. Those ports which have not been used or have abnormally low figures are easily identified. This means that faulty or hung modems are quickly identified and either fixed or busied out.
Simple procedures such as checking that all the terminal servers are functioning correctly each morning and physically checking the modems, can go a long way towards reducing the impact of hardware failure and hence improving the reliability of the service.
In the near future the entire modem bank will be migrated to its own digital PABX in the Prentice Centre machine room. In this configuration, the individual PSTN (Public Switched Telephone Network) lines to the local exchange will be replaced with a number of ISDN (Integrated Switched Digital Network) primary rate lines. It is expected that this change will impact significantly on the quality, management and support of this service.
One primary rate consists of 30 channels and can therefore replace 30 individual PSTN lines. Simply having less lines coming into the machine room will save space and management time, not to mention copper wires which are becoming a scarce resource.
The quality of the lines and consistency of connections will be greatly improved with this new hardware. The clients will subsequently see a better quality of service and hence the demand for user support will decrease with less problems associated with bad or inconsistent line quality.
The digital system allows for more flexibility in configuration of Hunt Groups. Hunt Groups will be able to contain many more modems and changes and moves will be possible. This should lessen the time required for management, maintenance and monitoring of the communications hardware.
Another important effect of this new system, will be an improved ability to maintain a consistent level of service, as the number of users increases. With the current system it is difficult to keep up with the rapidly increasing demand due to the excessive lead time for installation of PSTN lines. (It has been known to take just short of six months to get sixteen lines terminated, as a Hunt Group, in the Prentice Centre machine room) This delay can result in unnecessary and unacceptable levels of congestion. With a digital PABX new modems can be installed with the time for procurement of the modems the only delay. Even if a new primary rate connection is required the maximum expected delay is two months. Additionally, if one rotary is particularly badly congested, modems can be temporarily moved from another to re-distribute the load.
In order to gain an appreciation of the resources required to administer a service such as this one must be aware of the scale of the task at hand. At the beginning of semester the staff of client services were processing 1000 new accounts each week. It gradually tapered off to the current rate of about 40 a day.
Approximately, 6000 accounts have been set up this year which amounts to 12000 counter contacts. On top of that they also change about 25 forgotten passwords and arrange five account upgrades every day. All this, even before any requests for help or reports of problems!
Some of the procedures for administering this service have been streamlined to improve efficiency but others are still very labour intensive.
Prospective clients lodge an application form with client service and are asked to allow five days for processing. Accounts are set up easily using scripts to which all client service staff have access. These scripts are linked to kerberos (the security system), the servers and the modem management software. This automation has meant that the setup process is now simple and quick for both client service and the staff responsible for the above systems. Upgrades to access time threshold are also performed using these scripts.
This automation of tasks only reaches so far. Once the account is set up client service staff have to transfer the information by hand to a form that is returned to the users. Additionally, there are still some administrative tasks that can not be performed by client service, leading to duplication. For example, more disk space can only be allocated by forwarding the details to the system administrator.
Once accounts are set up the information about each user is distributed between several different databases accessed by the modem management software, the security system and the servers. This makes retrieval of a user's profile difficult and unnecessarily time consuming. Also, problems can occur as a result of inconsistencies between data from the different databases.
At the beginning of the year the administrative load could only be met by an additional staff member (increasing the total help desk staff to five, three of them working almost entirely on this service) and lots of overtime. Eventually, this marathon effort by the staff of client service could not be maintained and yet another staff member was employed on a casual basis.
As well as the demand on human resources there was another major by-product - lots of filing! The paper trail produced by administration of this service is using up too much valuable filing space, not to mention the trees.
The more that can be done from one central point via automated procedures, the more duplication, time and other resources can be saved. Storing all information about users in one central database will streamline management of this data.
A systems specification has been produced for a central database of all users with back end interfaces to the existing individual databases. Links to the accounting software used in the Centre may also be developed. Graphical data entry and retrieval interfaces and printable reports will be also be designed. Development of this software will begin soon.
The human toll in direct system administration of this service is not excessive particularly since the development of automated scripts. Two servers hold the accounts and mailboxes for the majority of the 13000 users. While there are significant human resources involved in maintaining the operating systems and environments on these servers the real pressure lately, has been on the machines themselves. The same growth that has strained all areas of this service has caused these machines to all but ground to a halt much faster than anticipated. Almost all other applications have been removed from these machines in order to keep them running well enough to provide POP mail and other services to the clients.
The state of these machines has resulted in many problems for users of the services and hence put a huge strain on support. This has clearly illustrated that one area of this service can not be affected without all other groups involved feeling the impact.
As interest in the Internet expands into the wider community not only does the number of users increase, but, perhaps more significantly, the computer knowledge of these users decreases. This has meant that existing support services have been expanded and new ones introduced to cope with the resultant increase in demand for help and support.
In providing user support for this service centre staff have in the order of 250 to 350 client contacts per week under normal conditions. This can increase dramatically when there is a problem affecting all or a large number of users. A client contact is defined as a request from a client and response from a Prentice staff member. Therefore, for one client with one problem there may be more than one contact. The centre is trying to streamline user support by defining support services and channelling clients towards using these services. This will reduce the number of occurrences of Prentice staff being interrupted and side tracked by engaging with clients outside designated support services.
The majority of contacts can be broadly categorised into the following areas.
How these queries are received and handled by each of the provided support services is detailed below. Those queries that come through other channels are directed to one of these services whenever possible.
The help desk is very often the first "port of call" for a user having problems. For most services this group is primarily a referral service. However, their role in support of dialup networking services has been expanded in an attempt to solve more users' problems upon first contact. Two salaries are now funded explicitly for support of this service and staff will be trained to obtain the required information and solve many of the common problems themselves.
Client Services receive between about 40 and 50 queries each week day under normal operating conditions. At least two thirds of these come by phone, most of the remainder across the counter and a few by electronic mail.
Client Services receive queries and reports of every type imaginable. Generally, the most common queries are about set up and configuration of the communications software and hardware. Many of the simpler problems are solved by client service and the remainder are usually referred to the Clinic or documentation (see below). The next most common type of query are reports of problems connecting or staying connected. Such users are informed of any known problem at Prentice or referred to the clinic or Network Services.
The Centre publishes several Fact Sheets detailing many aspects of our dialup networking service. Keeping these up to date for such a dynamic service is extremely difficult and requires excellent lines of communication between all groups involved. This has proven to be a popular information source, client service have been known to spend $30000 in a year on photocopying!
More and more information is being provided on-line, for access via the World Wide Web. In addition to electronic versions of the factsheets, a large portion of the Prentice Frequently Asked Questions is devoted to dialup networking services. Users can also find information about utilisation of the banks and the best initialization string to use with their modem.
On-line information takes some pressure off the production of printed material but it can never be a complete replacement. There is still the problem of keeping the information up to date.
The Centre has setup an email list for queries and problem reporting for dialup networking. This list expands to staff members from all the groups involved in providing the service.
Approximately 30 to 40 messages from clients are received each week on this list. The most common problems seen on the list are with the physical link. Queries such as
"I often have to dial several times before my connection will stay up for more than a few minutes. What's wrong?"
or
"I can only talk at 19200 but my modem is 28.8K - why?"
and similar, account for up to half of all messages. They are usually a result of modem incompatibilities, noisy phone lines or faulty or hung modems at either end of the link. Suggestions are usually made via email but often the problem is just "a fact of life". Several questions regarding the access and usage control system are received each week and are usually easily answered via email. A few questions relating to setup and configuration or down-loading of software are received and the user is usually referred to the clinic or documentation. The remainder of the messages are generally reporting problems (for example a particular phone number is not responding) or related to a problem or situation not specific to an individual client.
There is also a newsgroup which is monitored by a number of staff but largely looks after itself with more experienced users assisting the novices. Notices of expected down-times affecting this service are posted to another newsgroup designed for reporting the status of the whole network.
Due to the huge volume of phone and counter enquiries coming directly to Network Services and the subsequent strain on resources a time and place was designated for people to come with such queries. These Dialup Networking Clinics are run four times a week including one session on Saturday morning. One full time and one part time staff member have been employed to manage these sessions and handle the majority of queries that come in at other times.
Numbers have declined since the start of this service, except for a few notable jumps, and now appear to have reached a steady level. At the introduction of the service, between 15 and 20 people were attending. The queries were predominantly relating to initial set up and configuration, particularly under Windows 95. These numbers tapered off slightly to between 10 and 15 by the end of term. The number then jumped after the Easter Break as users had time to get on and have a go. The numbers continued to drop, especially after the publishing of a "Win95 FAQ" which significantly reduced the queries in that area. The current attendance is about 5 to 8 people or more when there are problems with centre equipment, particularly when the cause of their difficulties is not obvious to the user. Staff from the clinic will also occasionally arrange other times to help users if their problem was not solved at the clinic or they were unable to attend.
The sessions are very informal with the format depending on the breakdown of queries on the day. For example, if a large number of queries are about setting up Win95 then one of the staff members will take the whole group through the process together. However, if there are lots of different problems and different levels of knowledge each one will be addressed individually.
The Prentice Centre produces disks of shareware software pre-configured for dialling in to the University. These disks are produced in IBM compatible and Apple Macintosh format and sold through the technology shop with free upgrades available. It is then the responsibility of the purchaser to register any shareware software where required. These disks make setting up much easier for our users and hence reduce our support load.
It is expected that the above support services will continue free
of charge to all account holders and that additional charged services
will be introduced. One proposal is to introduce a joining fee
for all new external accounts which would fund ìon siteî
set up if required and a help line to be operated by technical
staff during extended hours. Staff and students with free accounts
would be able to access these services on a user pays basis.
The growth in demand for dialup networking services has increased, and continues to increase, at an astounding rate. This has put enormous pressure on the resources of the Prentice Centre.
The methods for administration and access and congestion control of this service are constantly monitored, modified and improved to maintain a consistent level of service as the user base increases.
The configuration, maintenance and management of the hardware can have a significant impact on the quality and consistency of this service. To this end the existing communications equipment is shortly to be replaced by a digital PABX. Use of hardware management tools is also increasing.
As interest in the Internet spreads to the wider community the computer skills and knowledge of the average user is decreasing. This means that the demand for user support is increasing at an even more rapid rate than the user base. The Centre has responded to this by introducing a number of support services and plans to expand these in the future.
The authors would like to acknowledge the assistance of the following people.
John Currie, Client Service Manager and Maralyn Kenley, Help Desk Supervisor and the Help Desk Staff.
Mark Williams, Acting Associate Director - Infrastructure and the staff of Network Services particularly Tony Madsen and Tony Sarathchandra.
Graham Rees, Director of the Prentice Centre, for permission to publish this paper.